
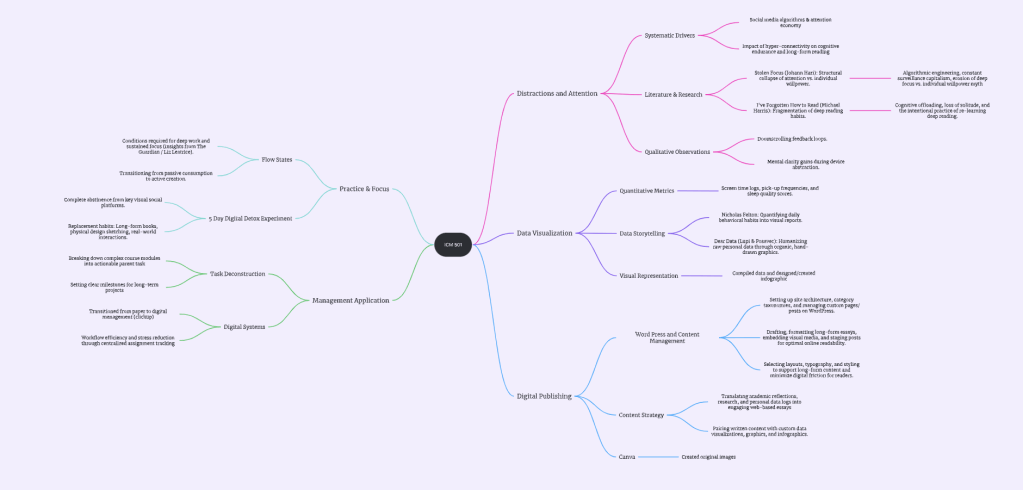
When you’re juggling research, personal data, and creative projects, a traditional outline does not always work. Lists can make your ideas feel boxed in, especially when your thoughts do not follow a straight line. Finding a way to solve this problem was something that my creative side immediately jumped at. Creating a mind map turned my brainstorming into something more visual and easier to follow. Mindmaps.com describes a mind map as a visual way to organize information around a central idea and show how different concepts connect. Instead of having a long list of ideas that are all over the place, I can now see how different thoughts, sources, and pieces of information relate to each other.
When creating my mind map, I made the central idea about a course I’m in, so I can organize all my learning into one place. From there, I created branches for the major topics and concepts we covered throughout the course. Each branch was then broken down into more specific ideas, readings, examples, and notes which all connected back to the main topic. This gave me a way to see how individual lessons fit into the larger course instead of treating every assignment, reading, or class discussion as a separate piece of information. As I continued adding to the map, it became a visual overview of the course and connections between what I was learning.
I also used the map to connect course material with my own observations and experiences. When a concept from class related to something I had noticed in my own use of technology, media, or advertising, I could add that connection directly to the relevant branch. For example, ideas about attention and technology could connect to research like Johann Hari’s Stolen Focus, which looks at the different factors affecting our ability to focus. This made the information feel more useful because I was not just recording what I learned. I was also thinking about how these concepts will continue to apply in my real life. As the map grew, I could see which topics connected to each other and which areas I wanted to explore more.
Another benefit was being able to organize information without having to decide on a strict order. Typically, my notes are separated by lecture, reading, or assignment. With a mind map, I could group ideas based on how they relate to each other. This was especially helpful when different parts of the course started building on one another. Everything began to make sense.
The visual side of mind mapping also connects to projects like Dear Data, which uses drawings and visual organization to communicate personal information. Looking at projects like this shows how data doesn’t always have to be a spreadsheet or big blocks of text. For my own mind map, this meant thinking about not only what information I wanted to include, but also how I could organize it so that the connections were easy to see.
The main goal of creating this mind map was to turn this large amount of course material into something I could understand and use. It gave me a better way to look back at what I had learned this semester instead of scrolling through pages of notes or trying to remember where I wrote down a specific idea. The map had become a visual record of my learning. By organizing information around connections rather than just the order I learned it, I could finally see the bigger picture and how I can implement these ideas in the future.


Leave a Reply